What's the Berkeley Real Estate Market Like?
Berkeley, CA 5 Jan 2009
|
|
|
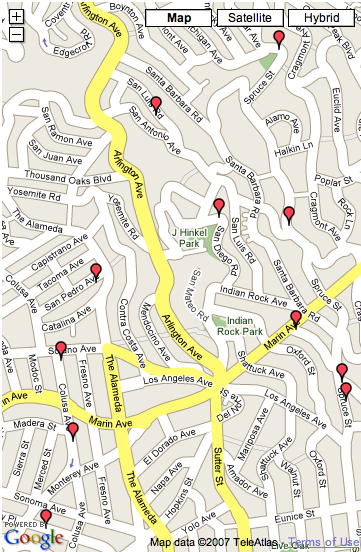
Click the map below to
search for homes
|
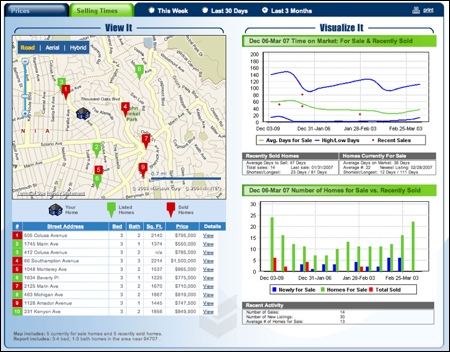
Click the image below to
receive your market snapshot
|
Several times a year I compare sales activity to the previous years. I'm writing this on 5 Jan 2009, and just compared 3rd/4th Quarter 3 bedroom sales for 2008 with those of 2007.
I use 3 bedroom home sales simply because there are more 3 bedroom homes sold in Berkeley than any other bedroom count.
2008 has been such an usual year, that I wanted to see how 6 months of sales compared.
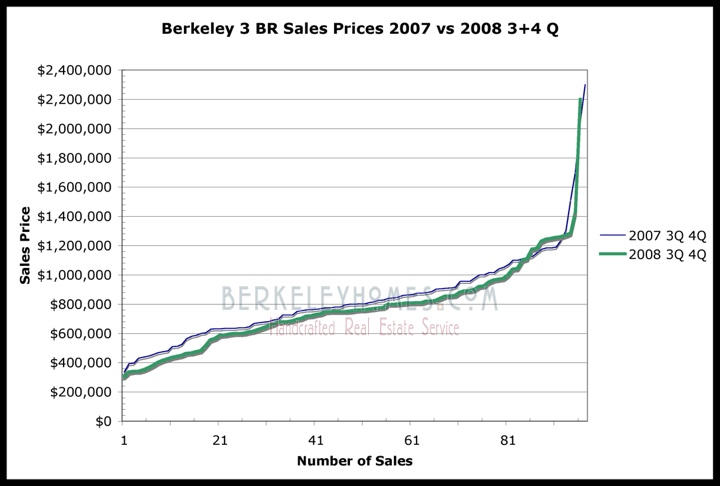
The thicker green bar graphs 2008 sales information, the thinner blue line shows sales price distribution for the same 3rd/4th Quarter of 2007.
The horizontal axis simply indicates the number of sales, and the graph shows the distribution of sales prices from low to high.
What does this all mean?
There were almost exactly the same number of 3 bedroom homes sold in in Berkeley in the 2nd half of 2008 as there were in 2007. I would have normalized the data (see graph below) if they were different.
Thoughout almost the entire range, Berkeley California 3 bedroom homes sales prices were lower in 2008 than the same time period in 2007.
In the 2nd half of 2008, median price (half sold for more, half sold for less) of 3 bedroom Berkeley homes dropped about 5.6% from that in 2007.
So... Berkeley is somewhat insulated from the changing real estate market, but it's not immune.
Curious about the 1st half of 2008? Here's the research for you
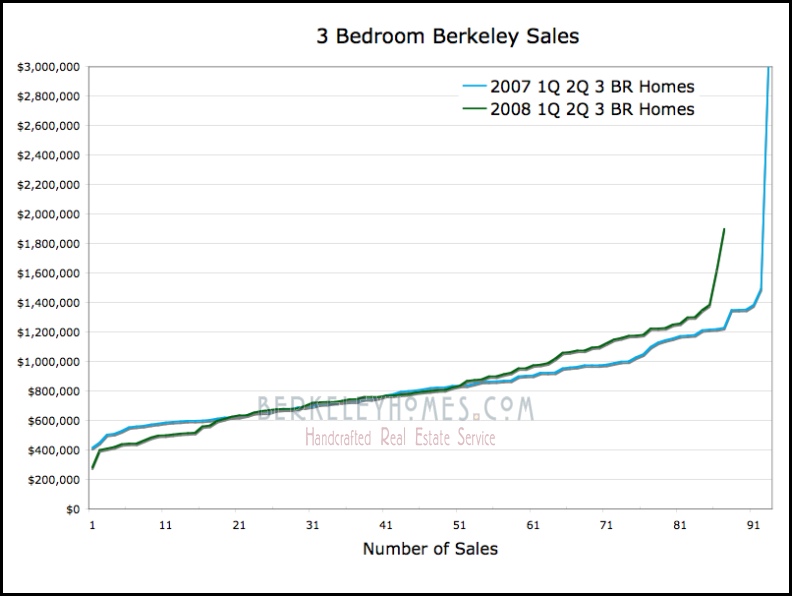
There were fewer 3 bedroom home sales in 2008, so I couldn't tell exactly how to compare the two years, until I "normalized" the data.
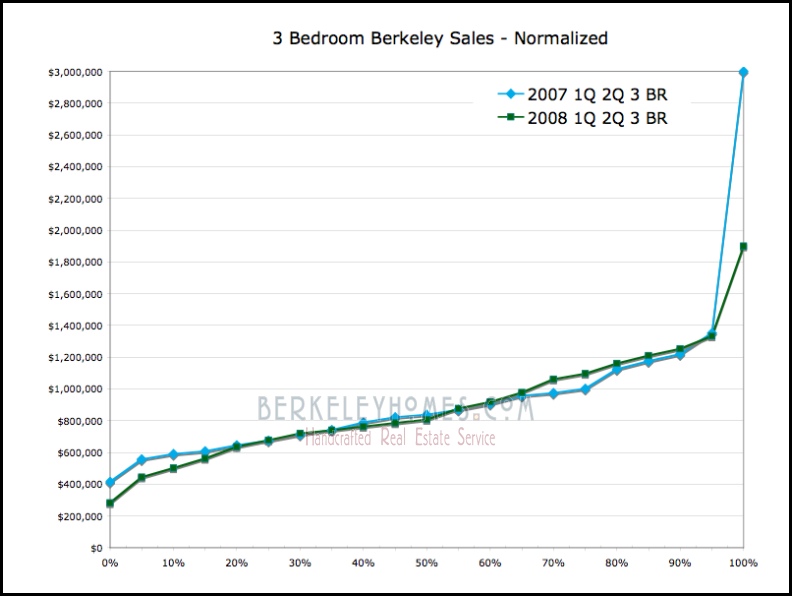
And for the first half of 2008, the 3 bedroom home sales prices tracked 2007 for the same period almost exactly! In fact, the more expensive homes (those in the 65 - 90 percentile) sold for more money in 2008 than in 2007.
But as the graph at the top of this report shows, things definitely changed in the 2nd half of the year.
May we live in interesting times!
Ira Serkes
Berkeley, CA 5 Jan 2009
|
